Understanding Column Color Charts and Statistic Diagrams
When it comes to visualizing data, column color charts and statistic diagrams are powerful tools that help people understand complex information at a glance. These visual representations are used in various fields such as business, education, technology, and research. By using colors and shapes, they make it easier to compare data, identify trends, and draw conclusions. In this article, we will explore what column color charts and statistic diagrams are, how they work, and why they are important in today’s data-driven world.
What Is a Column Color Chart?
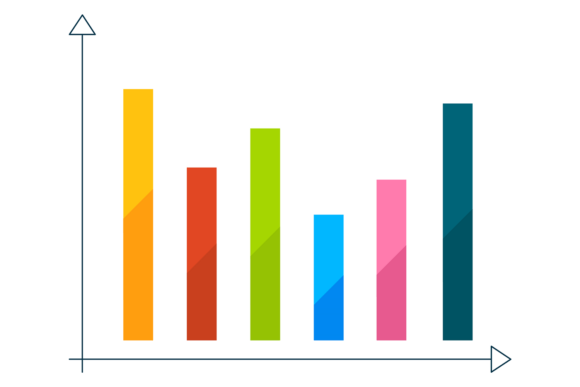
A column color chart is a type of bar chart where data is represented using vertical bars, or columns, that vary in height and color. Each column represents a category or value, and the color of the column can indicate different things, such as performance levels, categories, or changes over time. This visual approach helps users quickly grasp patterns and relationships within the data.
For example, if you’re analyzing sales figures for different products, a column color chart might use green for high-performing products, yellow for moderate performers, and red for underperforming ones. This makes it easy to spot which products are doing well and which need improvement.
How Column Color Charts Work
Column color charts function by plotting data points on a graph with two axes: the x-axis (horizontal) and the y-axis (vertical). The x-axis typically represents categories, while the y-axis shows numerical values. Each column corresponds to a specific category, and its height reflects the magnitude of the data point. The color of each column adds an extra layer of meaning, making the chart more informative and engaging.
These charts are especially useful when comparing multiple sets of data. For instance, a company might use a column color chart to compare monthly sales across different regions, with each region represented by a distinct color. This allows for a quick visual comparison without having to look at raw numbers.
What Is a Statistic Diagram?
A statistic diagram is a broader term that encompasses various types of visual data representations, including column color charts, pie charts, line graphs, and more. It is designed to present statistical information in a clear and accessible way. These diagrams are essential for summarizing large datasets and communicating insights effectively.
Statistic diagrams are widely used in fields such as economics, marketing, science, and public policy. They help professionals and the general public alike to interpret data and make informed decisions. Whether you're looking at election results, economic growth rates, or customer satisfaction surveys, statistic diagrams provide a visual summary that is easy to understand.
The Role of Infographics in Data Visualization
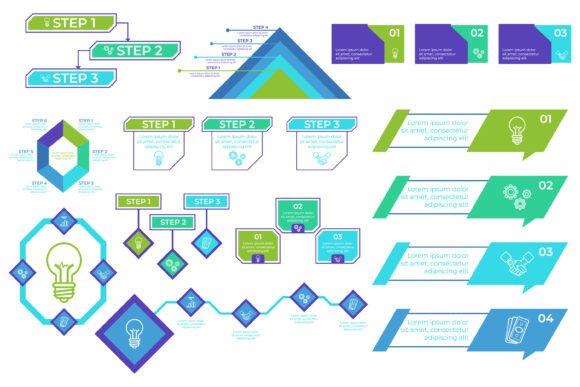
Infographics are a key component of modern data visualization. An infographic element isolated on a white background refers to a standalone visual graphic that is often used in presentations, reports, and digital content. These elements are designed to be clean, simple, and easy to read, making them ideal for conveying complex information quickly.
Infographics can take many forms, including EPS, JPG, SVG, and transparent PNG files. Each format has its own advantages. For example, SVG files are scalable and maintain quality at any size, making them perfect for web use. Transparent PNGs allow for seamless integration into different backgrounds, while EPS and JPG formats are commonly used for print media.
Why Column Color Charts and Statistic Diagrams Matter
In today’s fast-paced world, the ability to interpret and communicate data is more important than ever. Column color charts and statistic diagrams play a crucial role in this process by transforming raw data into meaningful visuals. Here are some reasons why they are so valuable:
- Enhanced Understanding: Visuals help people process information faster than text alone. A well-designed chart can convey a message in seconds that would take minutes to explain in words.
- Improved Decision-Making: Businesses, governments, and individuals rely on data to make informed choices. Charts and diagrams provide the clarity needed to support these decisions.
- Effective Communication: Whether presenting to colleagues, clients, or the public, visual data is more engaging and easier to remember than tables or spreadsheets.
- Identifying Trends and Patterns: By visualizing data over time, you can spot trends, anomalies, and correlations that might not be obvious from numbers alone.
Practical Applications in Everyday Life
Column color charts and statistic diagrams are not just for professionals—they are also useful in everyday situations. For example:
- Personal Finance: Tracking monthly expenses using a column color chart can help you see where your money is going and identify areas to cut back.
- Health and Fitness: Monitoring weight, exercise routines, or diet plans with a statistic diagram can show progress over time and motivate healthier habits.
- Education: Teachers use charts and diagrams to help students visualize concepts like population growth, historical events, or scientific data.
- Technology: Software developers and data scientists use these tools to analyze user behavior, system performance, and other critical metrics.
Common Misconceptions About Data Visualization
Despite their usefulness, there are some common misunderstandings about data visualization. One of the most frequent is the belief that more complex charts are always better. In reality, simplicity often leads to clearer communication. A cluttered chart with too many colors or details can confuse rather than clarify.
Another misconception is that all data needs to be presented visually. While charts and diagrams are helpful, sometimes a table or written summary is more appropriate, especially when dealing with small amounts of data or precise numbers.
It's also important to note that not all charts are created equal. Choosing the right type of chart depends on the data you want to show and the message you want to convey. A column color chart may be ideal for comparing categories, but a line graph might be better for showing trends over time.
Creating Effective Column Color Charts and Statistic Diagrams
If you're looking to create your own column color chart or statistic diagram, here are a few tips to keep in mind:
- Choose the Right Colors: Use colors that are easy to distinguish and avoid combinations that may be confusing, such as red and green for people with color blindness.
- Label Clearly: Make sure all axes, data points, and legends are clearly labeled so that viewers can easily understand the chart.
- Keep It Simple: Avoid unnecessary elements that may distract from the main message. Focus on the key data you want to highlight.
- Use Consistent Scales: Ensure that the scales on your axes are consistent and accurately represent the data being shown.
By following these guidelines, you can create effective and professional-looking charts that communicate your message clearly and efficiently.
Conclusion
Column color charts and statistic diagrams are essential tools for anyone who deals with data. Whether you're a student, a business professional, or simply someone interested in understanding the world around you, these visual aids can help you make sense of complex information. With the right design and presentation, they can turn raw numbers into meaningful insights that drive decisions and inspire action.