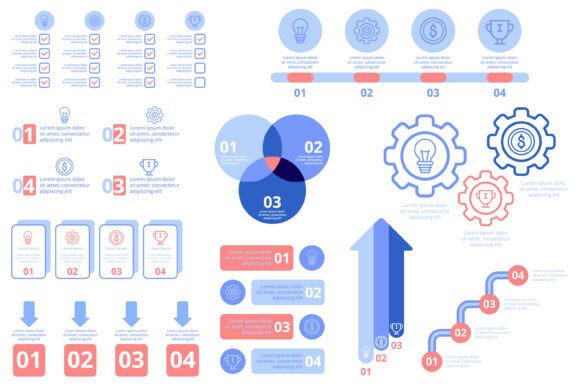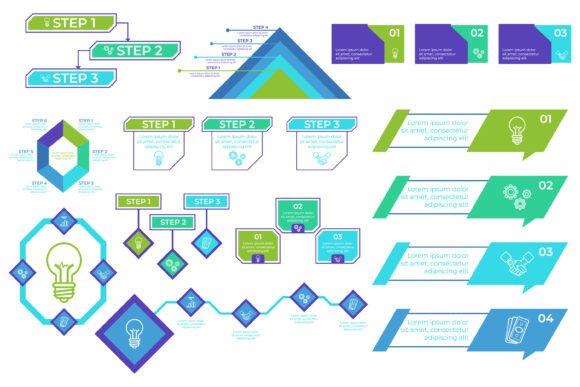
Understanding Infographic Arrow Labels and Color Info Plans
Infographics have become a powerful tool for conveying complex information in a visually engaging way. Among the many elements that make infographics effective, arrow labels and color info plans play a crucial role. These components help guide the viewer’s eye, clarify relationships between data points, and enhance overall readability. In this article, we’ll explore what infographic arrow labels and color info plans are, their significance, and how they can be used effectively in various contexts.
What Are Infographic Arrow Labels?
Infographic arrow labels are visual indicators that use arrows and text to show direction, flow, or relationships between different parts of an image. They are commonly used in diagrams, flowcharts, process maps, and other types of data visualizations. Arrows can point from one concept to another, indicating a sequence, causation, or connection.
For example, in a diagram showing the steps of a business process, arrows might connect each stage, with labels explaining the action or decision at each step. This makes it easier for viewers to follow the logic of the process without getting lost in the details.
Arrow labels are not just about pointing; they also add context. A simple arrow might indicate movement, but when paired with a label, it can communicate much more—such as “Next Step,” “Result,” or “Cause.” This combination of visual and textual cues helps ensure that the message is clear and understood by a wide audience.
The Role of Color in Infographic Design
Color is a fundamental element of any infographic. It can be used to highlight important information, differentiate between categories, and create visual hierarchy. When combined with arrow labels, color becomes even more powerful in guiding the viewer’s attention and reinforcing the message being conveyed.
A color info plan refers to the strategic use of colors within an infographic to support the narrative. This could involve using a consistent color scheme to represent different data sets, or using contrasting colors to draw attention to key points. For instance, a red arrow might signal a warning or an issue, while a green arrow could indicate success or progress.
When designing an infographic, it's important to choose colors that are both aesthetically pleasing and functionally effective. Too many colors can overwhelm the viewer, while too few may make the design feel dull. A well-structured color info plan ensures that the infographic remains visually appealing while still being informative and easy to understand.
Why Infographic Arrow Labels and Color Info Plans Matter
Infographics are designed to simplify complex information, and arrow labels and color info plans are essential tools in achieving that goal. They help break down information into digestible pieces, making it easier for viewers to absorb and retain the content.
In a world where people are constantly bombarded with information, the ability to convey ideas quickly and clearly is more important than ever. Infographics allow businesses, educators, and creators to present data in a way that is both engaging and easy to understand. Arrow labels and color info plans are key components that make this possible.
Consider a presentation on climate change. Without proper labeling and color coding, the data might be confusing or difficult to interpret. But with well-designed arrows and a thoughtful color scheme, the viewer can easily follow the cause-and-effect relationships presented in the infographic.
Practical Applications in Modern Life
Infographic arrow labels and color info plans are not just limited to professional or academic settings—they have practical applications in everyday life as well. From navigation maps to instructional guides, these elements help us make sense of the world around us.
For example, a city map might use colored arrows to indicate the best routes for pedestrians or cyclists. In a kitchen appliance manual, arrows could show the correct way to assemble a product, with labels explaining each step. These real-world examples demonstrate how these design elements are used to improve user experience and reduce confusion.
In education, teachers often use infographics to explain complex topics such as the water cycle or the human digestive system. By using arrows to show the flow of water or the path of food through the body, students can better visualize and understand the processes involved.
Creating Effective Infographic Arrow Labels and Color Info Plans
Designing an infographic that effectively uses arrow labels and color info plans requires careful planning and attention to detail. Here are some tips to help you create visuals that are both informative and visually appealing:
- Use consistent styles: Ensure that all arrows and labels follow a similar style to maintain visual harmony. This includes using the same line thickness, arrowhead shapes, and font styles.
- Choose appropriate colors: Select colors that are easy on the eyes and that serve a functional purpose. Avoid using too many bright or clashing colors, which can distract from the main message.
- Keep it simple: Avoid overloading your infographic with too many arrows or labels. Focus on the most important information and use arrows to guide the viewer’s eye naturally.
- Test for clarity: Once your infographic is complete, review it to ensure that the arrows and color coding make sense. Ask someone else to look at it and see if they can follow the flow of information without confusion.
Common Misconceptions About Infographic Design
Despite their popularity, there are several misconceptions about infographic design that can lead to ineffective or confusing visuals. One common mistake is assuming that more information is always better. In reality, less can often be more when it comes to infographics. Overloading a design with too many arrows, labels, or colors can make it difficult to read and understand.
Another misconception is that color should be used purely for aesthetic purposes. While aesthetics are important, the primary goal of a color info plan is to enhance communication. Colors should be chosen based on their ability to convey meaning, not just their visual appeal.
Finally, some people believe that arrow labels are unnecessary if the design is self-explanatory. However, even the most well-designed infographic benefits from clear labels. Arrows alone may not be enough to communicate the intended message, especially if the viewer is unfamiliar with the subject matter.
Conclusion
Infographic arrow labels and color info plans are essential tools for creating effective and engaging visual content. Whether you're designing an infographic for a business presentation, an educational resource, or a personal project, understanding how to use these elements correctly can make a big difference in how your message is received.
By combining clear visual cues with thoughtful color choices, you can create infographics that are not only visually appealing but also easy to understand. As the demand for visual storytelling continues to grow, mastering these design principles will help you stand out and communicate your ideas more effectively.